
Generative AI for Business · Transformation and Performance
If this is on your desk right now, EDON offers a free 30-minute sparring session, with no obligation.
Book 30 minutes (opens in a new tab)
Part of Transformation and Performance
A 13-week cash flow forecast shows, week by week, the cash a company expects to receive and pay, built from bank balances, invoices and payment dates. A CEO or CFO needs one as soon as any payroll, tax payment or loan instalment in the next three months looks uncertain. It shows the gap early enough to close it.
Thirteen weeks is one quarter. Most of its receipts and payments can be listed one by one, and a gap seen in week 6 still leaves time to act. EDON's own Excel template is free after a short form, in the Turnaround Toolkit.
In Finland, the Limited Liability Companies Act makes the board responsible for the appropriate control of the company's accounts and finances (chapter 6, section 2 (opens in a new tab)). The Bankruptcy Act defines insolvency as an inability to pay debts as they fall due that is not temporary (chapter 2, section 1 (opens in a new tab)). Both turn on the timing of cash, which a monthly budget does not show.
Use the direct method: list the actual receipts and payments expected in each week. (The indirect method starts from profit and adjusts it; it suits annual plans but is too coarse for weekly cash.) Every week carries the same lines.
| Line | Where the number comes from | Owner |
|---|---|---|
| Opening cash | Reconciled bank balances for all accounts at the weekly cut-off | Finance |
| Customer receipts | Open invoices, placed in the week each customer really pays; later weeks from the order book | Receivables lead, with sales |
| Other receipts | Asset sales, grants and refunds, once contracted | CFO |
| Payroll and pensions | The payroll calendar: net pay and pension contributions on their own dates | Payroll |
| Suppliers | Open payables by due date, orders not yet invoiced, recurring costs such as energy | Payables lead, with purchasing |
| Taxes | VAT and employer's contributions; in Finland both are self-assessed taxes due on the 12th of the month (Vero (opens in a new tab)) | Finance |
| Rent, leases and loans | Contracts and loan agreements | CFO |
| Capital spending | Committed orders only | CFO, with operations |
| Net flow | Total receipts minus total payments | Calculated |
| Closing cash | Opening cash plus net flow; next week's opening cash | Calculated |
| Minimum cash line | The lowest balance the company is prepared to hold | CFO proposes, board approves |
Set the minimum cash line to cover the heaviest week in the forecast, often a payroll or tax week, plus any minimum liquidity that a covenant (a condition the lender sets) requires. The toolkit's example uses four weeks of payroll; a company with large tax or loan weeks may need more.
The workbook EDON uses for this work is in the Turnaround Toolkit. Its eight tabs hold a dashboard, instructions, assumptions, the weekly forecast, a collections model that turns billing into receipts week by week, a covenant check, the liquidity levers and formula checks. A switch runs base, downside and stress scenarios, with a fictional manufacturer filled in as the worked example.
Exhibit 1
A simplified 13-week cash forecast
Fictional company, € thousands. Payments are shown as positive figures; brackets mark negative values.
| Week | 1 | 2 | 3 | 4 | 5 | 6 | 7 | 8 | 9 | 10 | 11 | 12 | 13 |
|---|---|---|---|---|---|---|---|---|---|---|---|---|---|
| Opening cash | 742 | 902 | 864 | 1,051 | 706 | 809 | 558 | 779 | 1,114 | 649 | 897 | 792 | 1,148 |
| Receipts | |||||||||||||
| Customer receipts | 563 | 608 | 541 | 652 | 518 | 587 | 579 | 631 | 597 | 602 | 571 | 652 | 498 |
| Other receipts | 118 | ||||||||||||
| Total receipts | 563 | 608 | 541 | 652 | 518 | 587 | 579 | 749 | 597 | 602 | 571 | 652 | 498 |
| Payments | |||||||||||||
| Payroll and pensions | 648 | 651 | 664 | ||||||||||
| Suppliers | 331 | 362 | 308 | 349 | 343 | 327 | 358 | 322 | 339 | 354 | 333 | 296 | 248 |
| VAT and employer taxes | 284 | 297 | 312 | ||||||||||
| Rent, leases and loans | 72 | 72 | 214 | 72 | |||||||||
| Capital spending | 46 | 92 | 31 | ||||||||||
| Total payments | 403 | 646 | 354 | 997 | 415 | 838 | 358 | 414 | 1,062 | 354 | 676 | 296 | 912 |
| Net flow | 160 | (38) | 187 | (345) | 103 | (251) | 221 | 335 | (465) | 248 | (105) | 356 | (414) |
| Closing cash | 902 | 864 | 1,051 | 706 | 809 | 558 | 779 | 1,114 | 649 | 897 | 792 | 1,148 | 734 |
| Minimum cash line | 600 | 600 | 600 | 600 | 600 | 600 | 600 | 600 | 600 | 600 | 600 | 600 | 600 |
| Headroom | 302 | 264 | 451 | 106 | 209 | (42) | 179 | 514 | 49 | 297 | 192 | 548 | 134 |
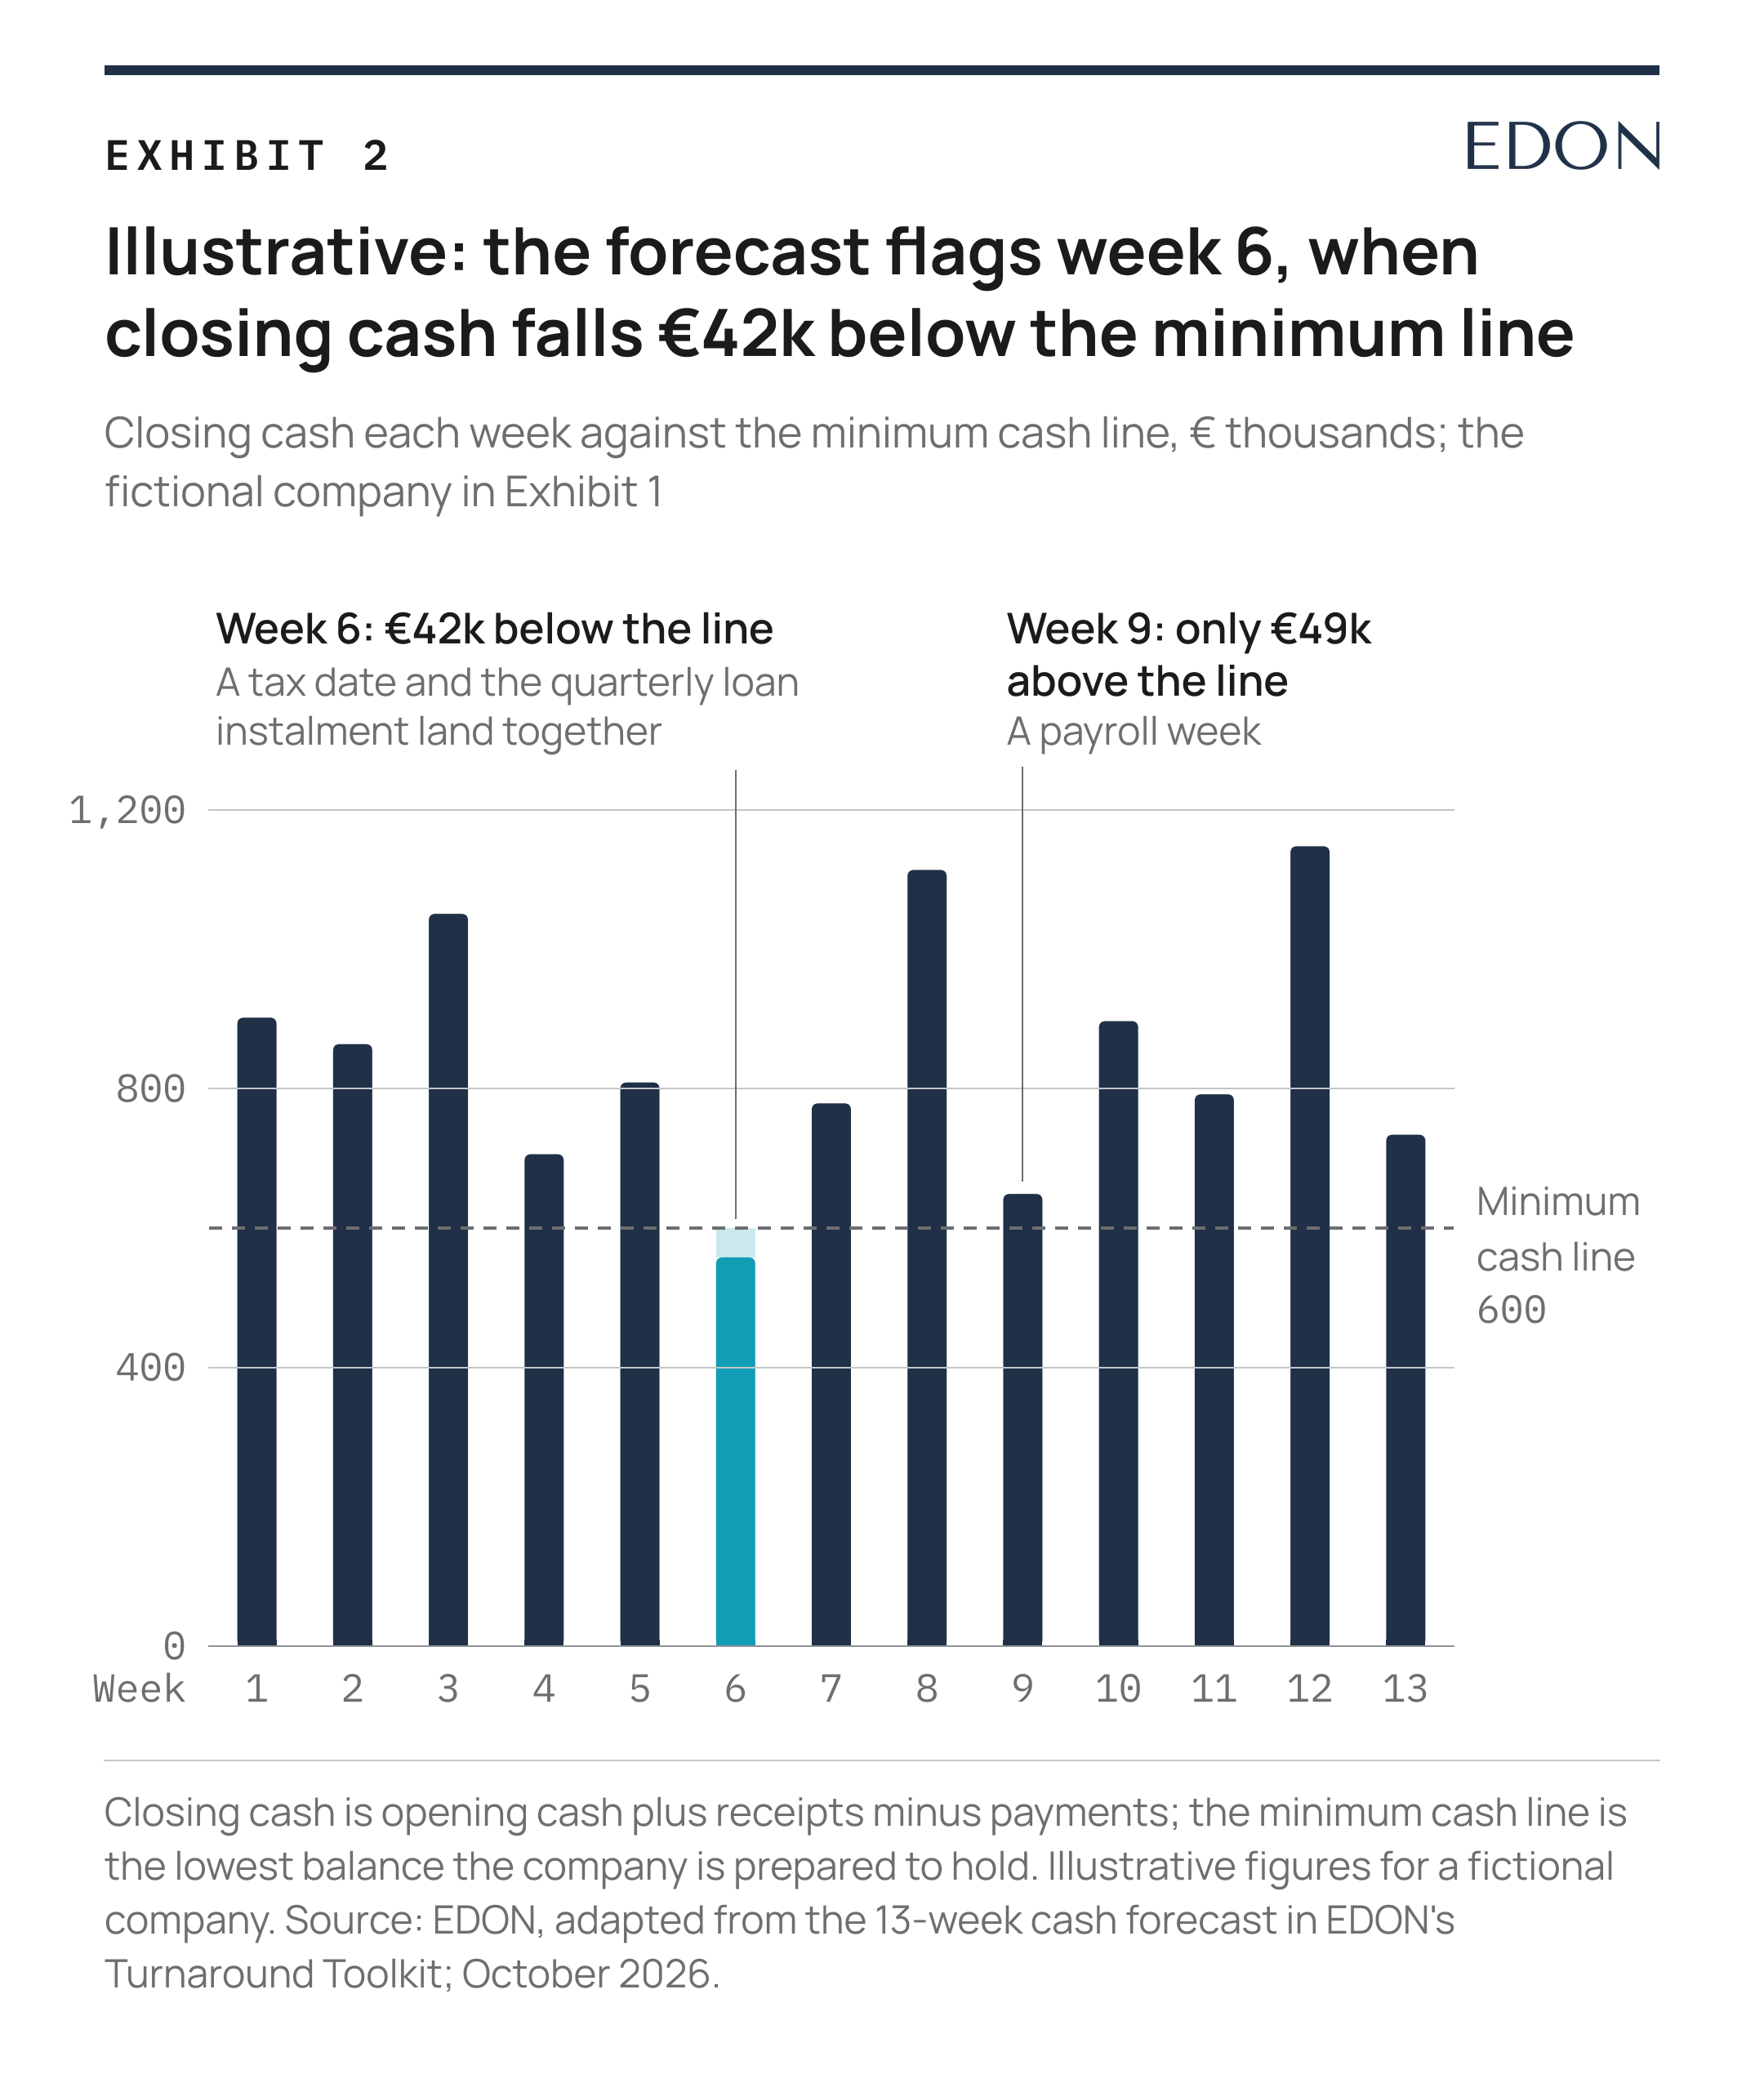
Exhibit 2. In week 6 a tax date and the quarterly loan instalment land together, and closing cash ends €42,000 below the minimum line; week 9 clears it by only €49,000.
Receipts and payments drift from the forecast every week, so its value comes from a weekly cycle on a fixed day:
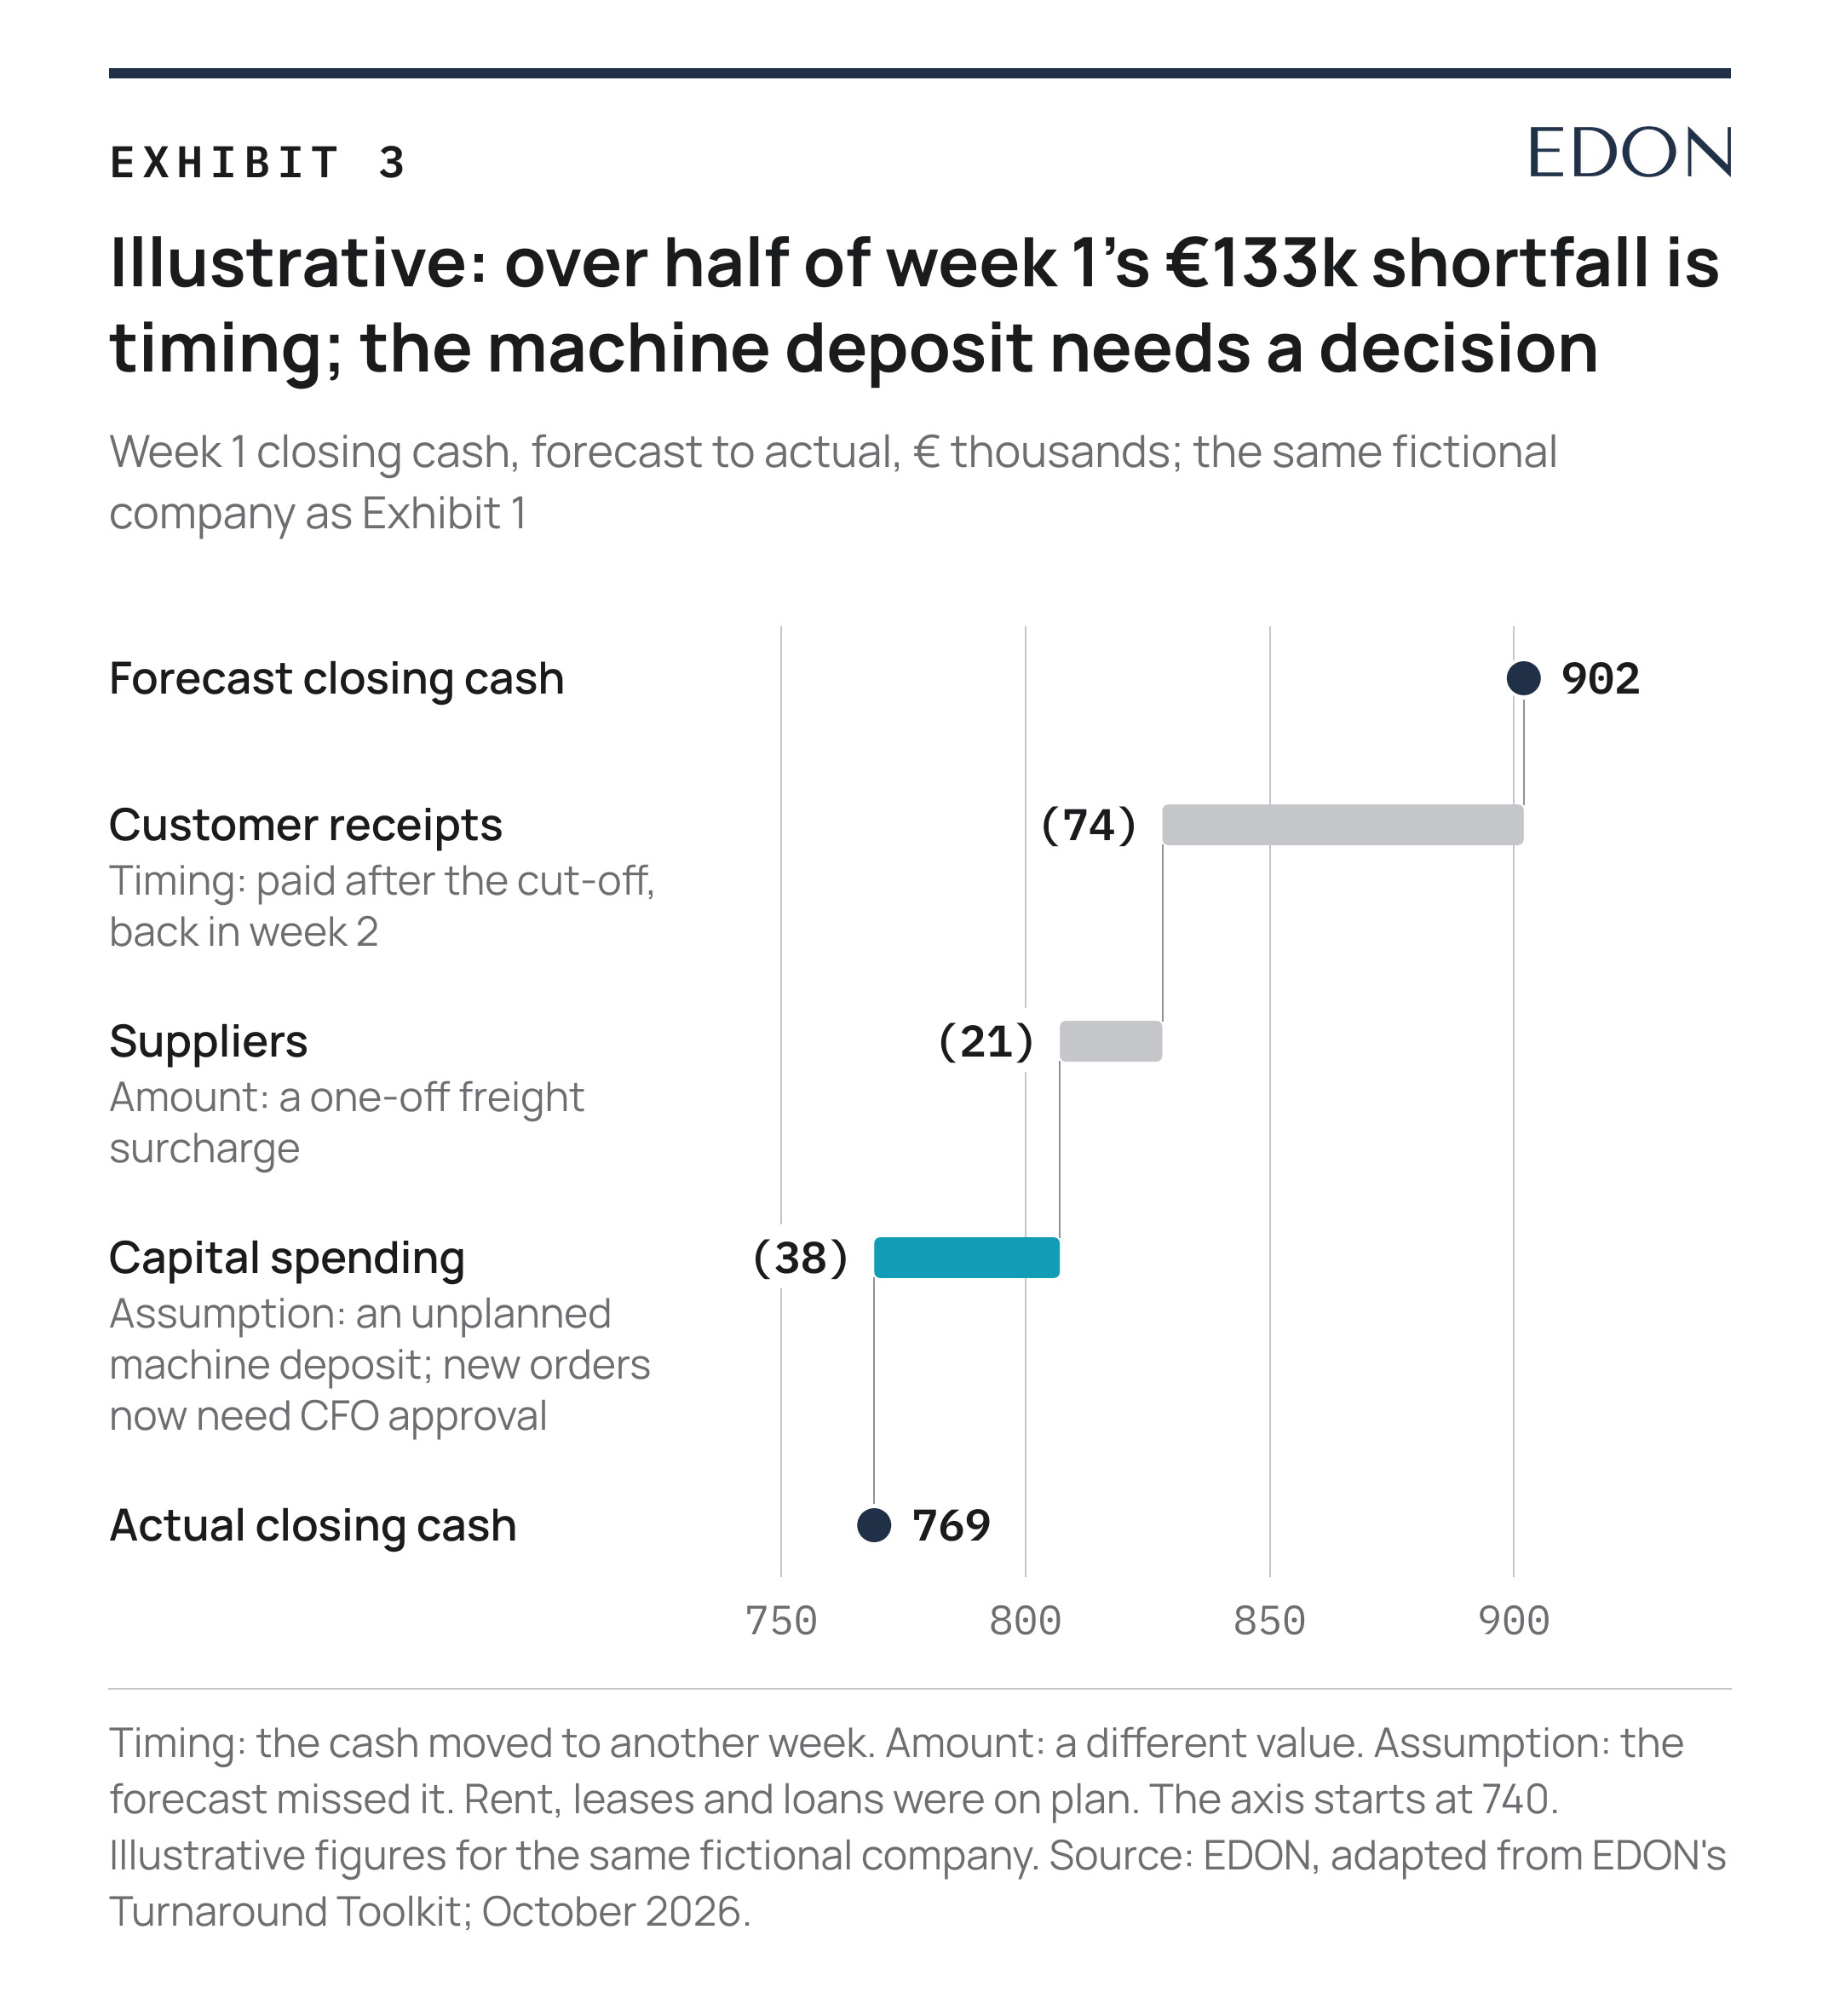
Exhibit 3. Of the €133,000 shortfall in week 1, €74,000 is timing and should return in week 2; the unplanned machine deposit forces a decision on who approves new orders.
For the CEO, one page is enough. EDON suggests a weekly cash dashboard with five things: cash today, the lowest point in the next 13 weeks and the week it falls, the headroom at that point, how far actual cash has moved from the forecast, and the decisions taken (Exhibit 4). One CFO guide expects a mature process to land within 5 per cent total variance by week four or five (Accordion (opens in a new tab)).
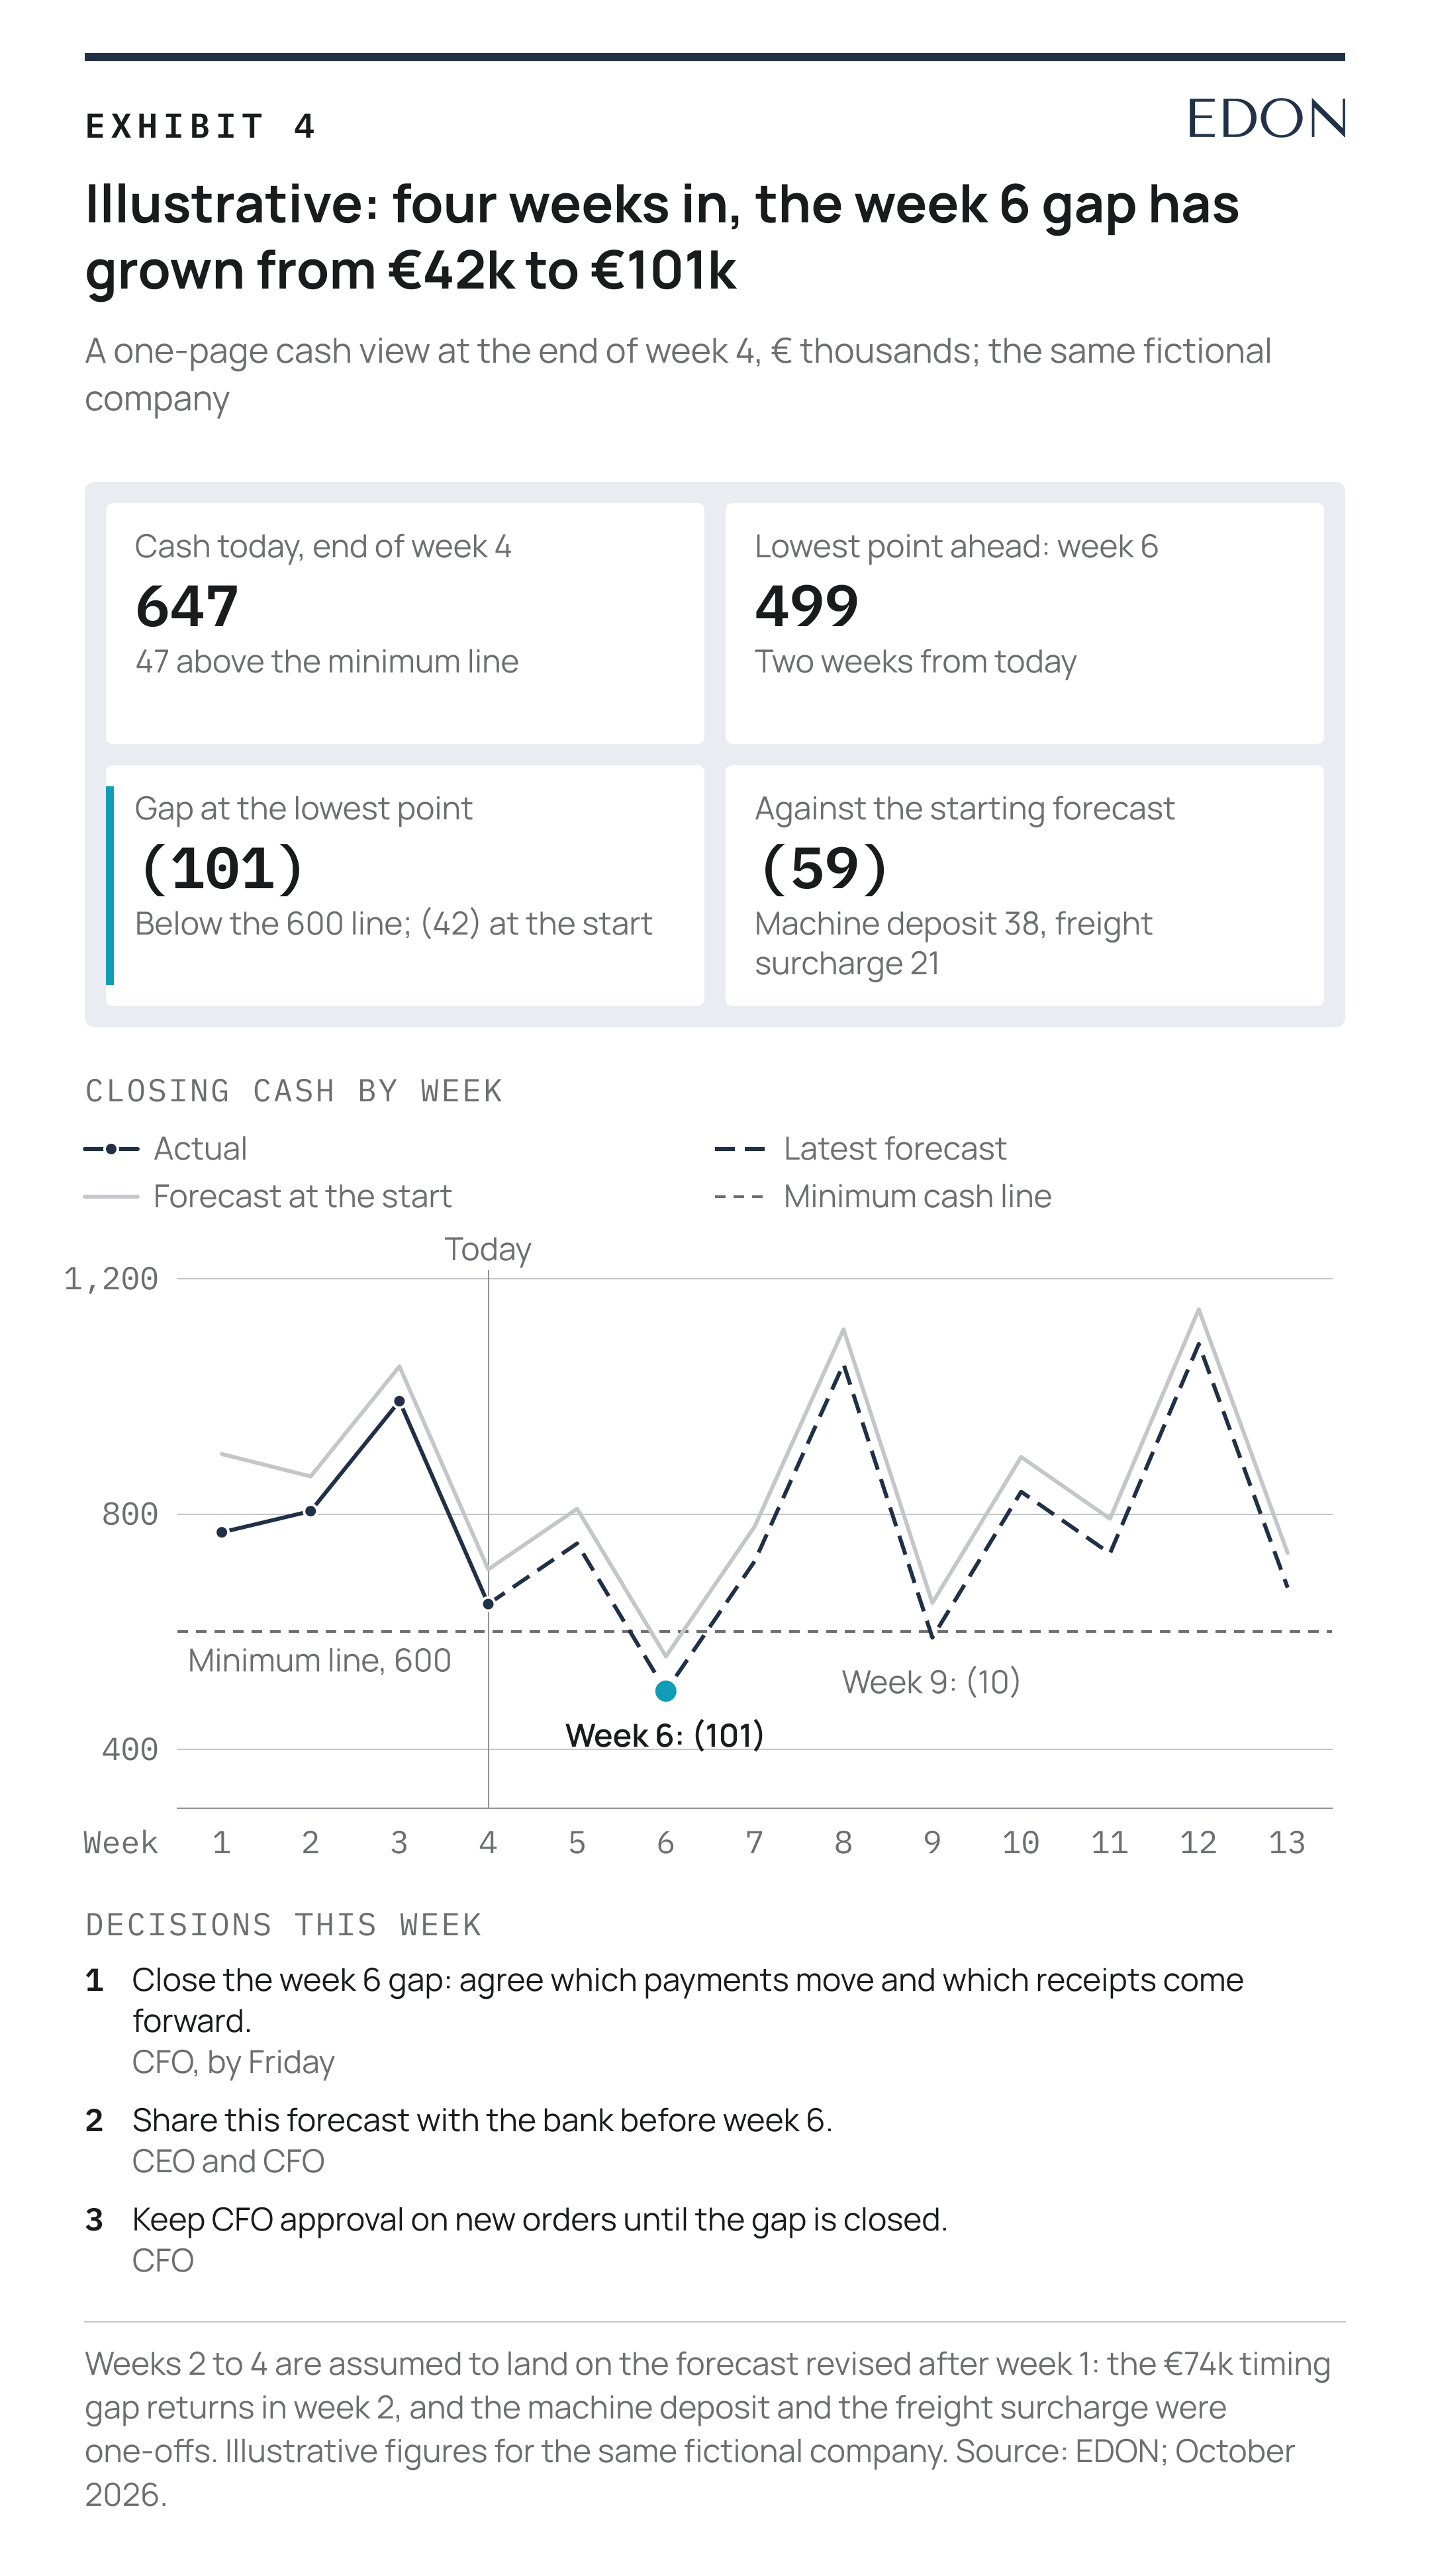
Exhibit 4. Four weeks in, the one-page view shows the week 6 gap has grown from €42,000 to €101,000, two weeks out, and week 9 now dips just below the line.
In a live cash crisis, add a short daily cash call, same time and same agenda, with decisions made before the day ends. When the pressure eases, the weekly cycle is enough.
EDON's Turnaround Toolkit follows four stages, called ARCS: Anchor secures survival in the first 30 days; Read diagnoses the root causes; Counter builds and runs the recovery plan; Sustain makes the gains permanent. The 13-week forecast is the central tool of Anchor, because cash buys time for every other decision. After the first 30 days it stays on as the weekly cash report. The steps after cash are set out in our guide to turning around a struggling company.
EDON is a strategy and transformation firm based in Finland. Early in the work, EDON puts a high-value, usable deliverable in your hands, something you can act on and keep, before you commit further. We call it the Head Start.
Before cash work starts, EDON agrees the scope with you, down to which companies and bank accounts the forecast covers, who on your side owns each line and what you will have at the end.
Where can I get a 13-week cash flow template in Excel? EDON's workbook is part of the Turnaround Toolkit, available through the toolkit form. Exhibit 1 shows the layout if you prefer to build your own.
How accurate does it need to be? Accurate enough to decide on. Near weeks are mostly invoiced already, so they should be tighter than later ones. Every variance should have a cause, and the forecast should get closer to actual each week.
Should we share it with our bank? If you are about to ask for a waiver (the lender's agreement to overlook a covenant breach) or new financing, EDON suggests sharing the current forecast before the bank asks. It shows that management can see the problem and has a plan.
Does the method work for companies in the Middle East? Yes. The lines and the weekly cycle stay the same; the calendar changes. Set the cut-off to the local banking week and load local tax dates. In the UAE, for example, VAT returns and payment are due by the 28th day after each tax period ends (Federal Tax Authority (opens in a new tab)).
If this is on your desk right now, EDON offers a free 30-minute sparring session, with no obligation.
Related


Resources for this capability
Four stages, from the first 30 days of cash control to the board’s role once the crisis has passed. Free to read.
